Investing
EML Payments: A non-cash income story?
I recently looked at EML Payments Ltd (ASX: EML), a prepaid card provider. Shares are down around 30% LTM despite cracking growth in the volumes of $$ using the company’s payment systems. The short version: I think that EML has an aggressive revenue recognition policy, a license to write non-cash income, and the incentives to potentially encourage it. …
I recently looked at EML Payments Ltd (ASX: EML), a prepaid card provider. Shares are down around 30% LTM despite cracking growth in the volumes of $$ using the company’s payment systems.
The short version:
I think that EML has an aggressive revenue recognition policy, a license to write non-cash income, and the incentives to potentially encourage it.
I also think that management are shrewd and know what they are doing by scaling the company towards profitability. I don’t think EML has gone off the reservation, but I do think there are a few things worth watching.
The long version:
EML grows primarily from acquiring new card businesses and striking new card partnerships with companies. In effect, EML piggybacks on its partners’ businesses & customers to grow their transaction volumes, and thus revenues. There is an interview with CEO Cregan here that talks about the challenges of this.
EML has grown at a rapid rate over the last few years, although business performance itself has not been so impressive due to lack of scale.
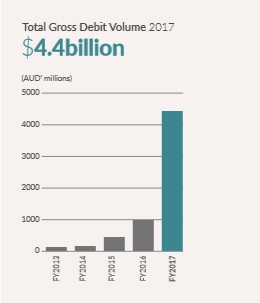 Gross debit volume (GDV) reflects the dollar value of the card transactions processed by EML. EML collects a small fraction of this in a variety of ways, so GDV should be a good indicator of whether the business is growing. GDV is not perfect though, for several reasons which will become apparent later.
What are the underlying economics of the business?
EML takes on average around a 1% fee on every dollar processed through its payment platforms. With that type of margin and its current scale, it cannot afford to market to customers – it must rely on its partner businesses to do the marketing for it. By attracting customers to their businesses (and encouraging them to use the cards), partners are – in effect – marketing for EML.
It is also vital for EML to keep costs under control. This is best illustrated by the fact that, despite a 10-fold increase in GDV and revenue over the past ~5 years, EML has only recently become profitable on an NPAT basis.
I don’t think that EML will earn anywhere close to its gross margins for some time, as it appears to be growing largely via adding new products and new countries, which add concerns in terms of regulation and compliance – implying that overhead costs will continue to rise. The business however does appear at least somewhat scalable.
How does the business work?
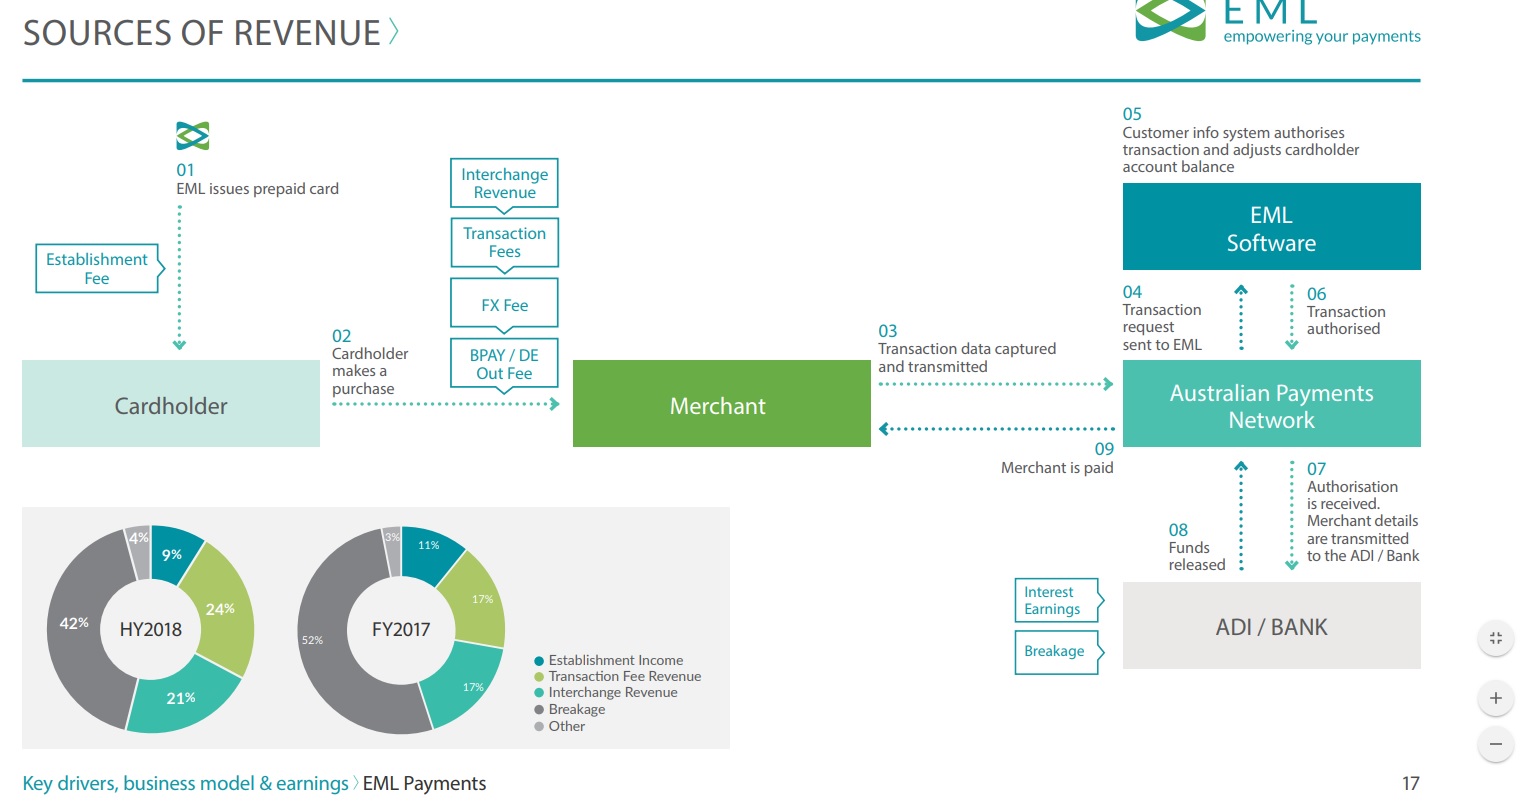
from the recent Goldman Sachs conference presentation (ASX ann.)
EML reports 6 sources of revenue. These are slightly different to what is noted in the pie charts in the above image, but close enough. The four meaningful sources of income are breakage income, establishment income, transaction fees, and interest income on stored value:
Breakage income: This is the unused $$ left on non-reloadable gift cards. Upon expiry, EML gets to keep what’s left on the card. Breakage revenue however is earned at the time the card is loaded:
“Breakage income is recognised following the funds being loaded onto Non-Reloadable cardholder accounts based on agreed terms and the residual percentage of the initial load amount that is expected to be left on a card upon expiry.….Where we expect to be entitled to a breakage amount and can demonstrate the ability to reliably measure future revenue, we recognise revenue using an estimated residual percentage applied to the funds initially loaded on these applicable accounts each month.”
If I load $100 on my non-reloadable card, EML earns say ~$4 in breakage revenue on the spot, which it doesn’t get to collect for ~12+ months, at which point there may or may not be $4 left. Average this across many cards using historical and other data, and you get the company’s breakage income.
This is clearly an opaque set of assumptions. I am not suggesting wrongdoing, but prima facie I would say that this is a metric that is vulnerable to abuse, especially given that breakage historically contributes >50% of revenue. Notably the tenor of the breakage has recently increased to 12-36 months from ~12-18 months previously. This apparently means that EML can be booking revenue up to 3 years in advance.
So assuming a 12-36 month expiry (1H18 prezzo; ~66% is <12mths), breakage accrual on the balance sheet will convert to cash over the next 1-3 years or so.
Recording income in this way is basically a license to print non-cash revenue. It is vulnerable to subtle changes in the assumptions used, and I have not been able to find consistent reporting of the historical assumptions. The exact percentage of GDV that becomes breakage income is not disclosed, and may have changed over time (more on that below). Other types of income are:
Establishment income: EML earns a fee at the time the card is purchased. I am not sure of the precise mechanism for this, which may vary by program.
Transaction fees: Comes from reloadable cards and also interchange fees on transactions (see chart). It appears that interchange income (from the above chart) comes under Transaction Fees in the annual reports.
Interest income (on stored value): Stored value is the amount of $$ stored on the gift cards. This money is deposited with a bank and is mostly carried off-balance sheet. EML earns interest on the stored value and some of the interest is shared with the bank. EML also runs some on-balance sheet card programs which result in the matching ‘receivables from institutions/liabilities to cardholders’ that you can see on the balance sheet.
Historically EML revenue has always run well ahead of cash receipts. This is partly due to how quickly the business is growing, but even so at least some of the revenue appears completely non cash:
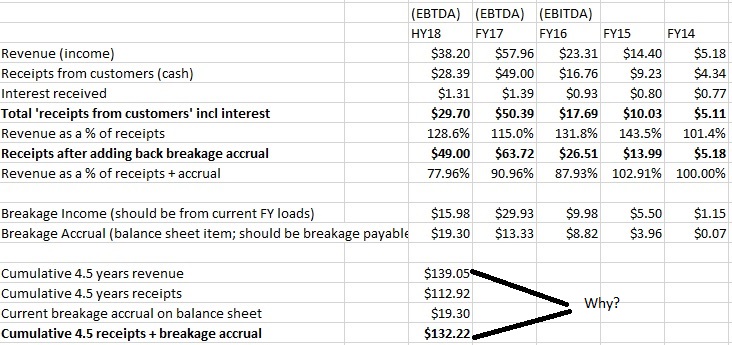
Cumulative 4.5 years of receipts + the breakage accrual on the balance sheet at HY18 ($19.3m).
The obvious source of non-cash income is breakage accrual on the balance sheet. In 2017 EML reported $13.3 million of breakage accrual. Given that this should mostly convert to cash in ~12 months, if I add that back to cash receipts, cash receipts + breakage accrual are now ahead of revenue. This doesn’t make sense because revenue should include accrual and it should be registered at the time the card is sold. There is a mis-match here which I struggle to explain. One possibility is that not all prior-year accrual has yet turned into cash and thus has been counted in multiple periods.
Over the past 4.5 years, EML has reported $139 million in revenue but recorded only $113 million in receipts from customers. If I add back the current accrual on the balance sheet ($19.3 million as at 1H18) the total jumps to $132.2 million, still $7 million short of cumulative revenue. (Other receivables of $9 million may account for the difference, but the breakdown of those is not clear).
Revenue, receipts and accrual are 100% reconciled in FY14. This was largely before the breakage businesses were acquired. Why do EML’s cash receipts from customers fall short of revenue even after accounting for breakage accrual?
I would be keeping an eye on this metric. There is reportedly a higher expected weighting of cash flow in the second half (greater than revenue) which may explain the difference.
Accrual being double-counted?
Taking the cumulative measure of accrual at 30 June over the past 4.5 years, accrual actually adds to $45 million, which appears to indicate that some of it has been double counted. 4.5 years receipts plus 4.5 years accrual adds to $153m, ahead of the $139m in reported revenue. Double counting may be normal, because some of the accrual lasts longer than 12 months before being turned into cash. Still, this shows that there’s not great visibility on when exactly accrual converts into cash, although recent presentations have started guiding for this.
Changing breakage assumptions?
Here is a chart showing breakage income and accrual relative to GDV over the past 4.5 years:
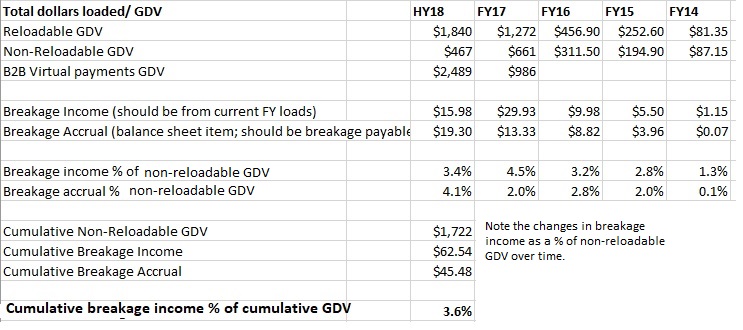
Given that EML earns around a 5.5% yield on non-reloadable GDV, it is clear that breakage is a vast majority of that amount. The other 1% or so is likely due to transaction fees and establishment fees.
I did find it interesting that breakage income as a % of non-reloadable GDV has increased over the past 4.5 years. Is this due to changing assumptions? Breakage is also getting more complex, due to the length of accruals as mentioned earlier.
Non-cash EBITDA?
The mis-match is even starker when it comes to comparing operating cash flow (OCF) and EBITDA or EBTDA. The metric varies by year with EML switching to EBTDA in FY17 (which presumably allows EML to include interest earned on stored value in their ‘EBITDA’ results). I will use ‘EBITDA’ in all cases when I refer to either metric:
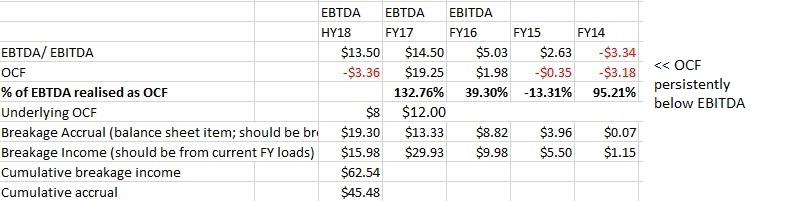
source: EML reports
FY17 OCF is well ahead of EBITDA because EML received receipts late in FY17 that it did not pass on to its partners before EOFY. These were passed on in the first quarter which contributed to the low HY18 figure. According to the 1H18 presentation (page 22), underlying cash flow in FY17 was $12.3 million. Underlying cash flow 1H18 was $8 million. In all cases underlying cash flow is persistently below claimed EBITDA. I feel this is a concern because of the apparent non-cash earnings, as well as because management’s incentives are set to EBITDA.
There is minimal break-down provided of the company’s operating cash flow statement, so there is not a lot of clarity around why there is a mis-match between cash flow and EBITDA. The most likely reason to my mind is the non-cash part of breakage income.
There are also things that can impact EBITDA, such as one-off expenses like the salary packaging biz in 1H18. Still, if you believe that the true value of a business is the sum of all future cash flows, you are not getting those cash flows with EML’s EBITDA.
The importance of breakage
Even excluding the impact of breakage accrual and non-cash income, EML’s results are distorted by the significant positive impact of breakage, which accounts for around half of revenue and cash flow. Given that breakage is literally free money, and results in a 5.5% yield on gross debit value (GDV) compared to 1% or less for other transaction types, EML seemingly has to grow the GDV of its other business lines 5.5x as much to achieve the same benefit as $1 GDV of breakage.
Breakage is an interesting one. It is other people’s money, but it is not easy to come up with an alternative suggestion for the way the money should be handled at expiry. It would be difficult to mandate that it be returned to the customer since many do not provide bank account details with non-reloadable cards. Alternatively it could be given to charity. Still, it would seem that there is some nominal risk of customer pushback, competition, or regulation here.
A sub-scale business?
It is my view that EML is being a bit optimistic when it describes its business by focusing on gross margins and excluding depreciation and amortisation from its costs. The underlying economics of the business have not been all that spectacular, because the company has been sub-scale to date.
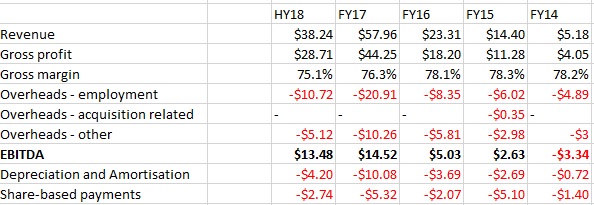
via EML presentations
Over the past 4.5 years revenue has grown 10-fold and employment costs have grown about 4.3 times while other overheads have tripled. This makes the business appear somewhat scalable, although with the above caveats about breakage and non cash income. Despite the considerable growth in the Reloadable and B2B businesses, given how much of a contributor breakage is to revenue and cash flow, I would hazard a guess that the Reloadable and B2B businesses are probably only breaking even or just above.
The bull case for EML is clearly that the business continues growing until it can scale up and earn actual margins closer to its gross margins. That will most likely require further additional acquisitions. If revenue can grow ~5x while expenses grow at the same historical rate (say around 2.5x) then the business should be quite profitable and probably good value today, depending on how long the growth takes.
A key question for me, which I won’t go into here for reasons of length, is how much capital has been employed (and will be employed in future) to grow the business and what kind of returns are they getting on it? This is difficult to evaluate because not all GDV is equal and EML has historically been unprofitable.
How much it will cost to grow revenue X times to scale up – and whether costs can be contained – is another key question in this equation. I have no easy answers.
Management incentives and share based payments
I find EML’s focus on EBITDA per share as a measure of both company performance and as a benchmark for management incentives curious. Over the next 3 years to 30 June 2020, in order to pay incentives, EML must hit:
- $0.141 in EBTDA per share (33% weighting)
- FY20 ROE target of 11.8% (33% weighting)
- Achieve a minimum of 70% of KPIs. Falling below 70% in the final year will result in all bonuses being forfeited.
One thing that stands out to me is that these incentives overlook debt. It is very easy to juice ROE and EBTDA by acquiring things with debt. Since EML seems to exclude the ‘I’ from ‘EBITDA’ it is not clear if they actually include or exclude interest expense/benefit from results.
Likewise, given how much EML has grown via acquisition, the decision to exclude share based payments (a key component of staff remuneration) and D&A from the performance metrics is a big free kick to management, especially given that further acquisitions appear likely.
Share based payments are pretty high – $16 million in the last 4.5 years, or 5% of the current market capitalisation – have been granted to employees. It’s hard to exclude this from financial performance with a straight face, even though the EBITDA per share metric compensates for it.
Speaking of share count (EML also has multiple millions of options, which I’ll exclude):
| 1H18 | FY17 | FY16 | FY15 | FY14 | |
| Shares on issue | 246,909,774 | 246,761,847 | 242,419,862 | 184,537,219 | 124,668,047 |
| EBTDA(/EBITDA) | $13.5 million | $14.5 million | $5 million | $2.6 million | – |
| EBTDA per share | $0.055 | $0.058 | $0.021 | $0.014 | – |
So if you double your share count every five years, exclude depreciation and amortisation and share based payments and future tax, have a decent amount of non-cash income, a license to print more, and the ability to borrow to juice the ROE; management and staff could make a lot of money via all these options which have been issued, and the value of which is likely inflated by the benefits of all the aforementioned exclusions. (One other thing I would investigate would be the actual issue price of these share based payments.)
It is hard to think of a better way to measure company progress. Still, I think EML should take steps to make its breakage accrual less aggressive. The company clearly has the ability to defer revenue until cash is received, which is what it already does when it can’t forecast breakage. My view is that EML should look to stop front-loading its revenues so much.
Director tenures
EML probably doesn’t meet the gold standard of governance as it has the CEO (a large shareholder) on the board, with the Chairman also being another large shareholder and board member. All directors have long tenures and fairly meaningful shareholdings. Ignoring the technical definition of independence, I find it unlikely that the independent directors are actually independent, although on balance as an investor I typically like boards like this as they generally bring deep expertise. These folks have been with EML since before it was EML.
Without commenting specifically on EML board members and executive staff, as I do not know them, I would assume generally that chummy boards are at greater risk of having weaker executive oversight. EML investors will have to keep their own watch on non-cash income relative to EBITDA and incentives.
The future of EML?
I have no position in EML and am not planning to take one. Ballpark though, over the past 5 years, EML has 10x its revenue with a 4.5x increase in staff costs and 3.4x increase in other overheads. Assuming that performance repeats over the next 8 years, this is – purely hypothetically – what it might look like:
| FY25 guesstimate | FY17 | ||
| Revenue (assuming it 10x) | $579.6m | $57.96m | |
| Gross margin (assuming 75%) | $434.7 | $44.25 | |
| Overheads – employment costs (assuming they 4.5x) | -$89.91 | -$20.91 | |
| Overheads – other costs (assuming they 3.4x) | -$34.88 | -$10.26 | |
| EBITDA | $309.91 ( = 70% ebitda margin) |
Reader Mark states that future revenue growth will occur at minimal incremental cost, and you can read his opinion in the comments at the end of this post.
So today EML could be priced at ~1x 2025 EBITDA? I think that is an unlikely scenario because it would require huge growth in breakage income, whereas more of the future growth appears likely to be reloadable or B2B, which is less lucrative. Still if EML can scale revenue faster than costs, then it could become decently profitable.
The bottom line
In short, I think that EML is aggressively recognising revenue, in a way that could potentially encouraged by management EBITDA and ROE incentives. It is an interesting business though, and my brief opinion is that management are experienced and have a clear strategy. If the business can continue scaling, it could get interesting. One for the watch-list, perhaps.
I have no position in EML whatsoever. This is a disclosure and not a recommendation.
While I have worked hard to be accurate, it is possible that errors exist in this post. There may also be small differences in numbers due to rounding.